Categories
Forecasts GBP/JPY Trading

GBP/JPY outlook and forecast

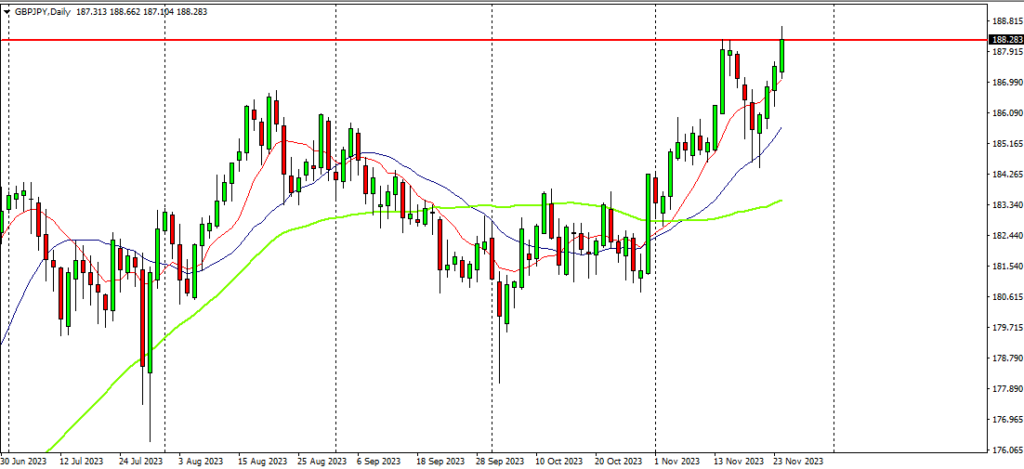
Based on price action, on daily, price is trying to break 186.283. Not a complete breakout yet. Last Friday when market closed at this level that was its second failed attempt to break this level in 2 weeks. It might prove to be a strong resistance level. Last time price reached this level was in November 2015.

Second failed attempt to break resistance

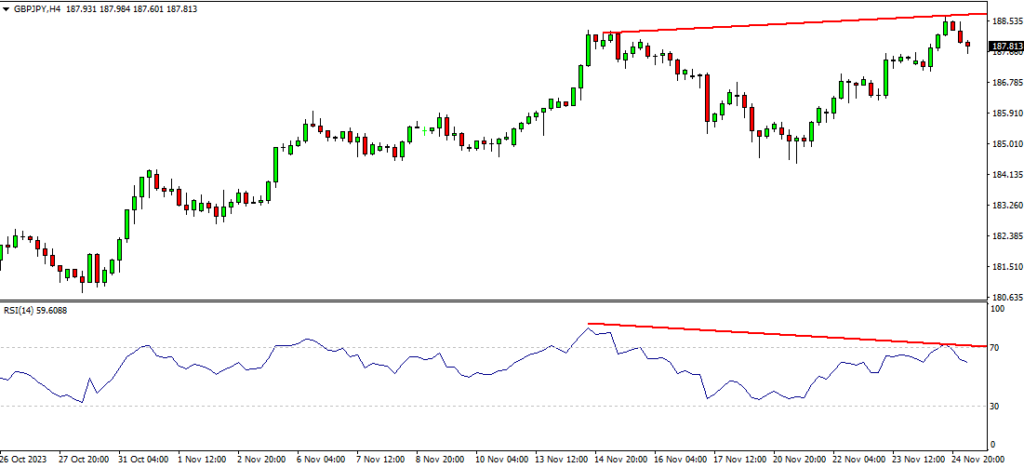
On 4 hour chart it just peaking its head out but can very well be a false break.

Looking at RSI on 4 hour chart, it is showing a bearish divergence as the RSi reached just above 70 mark.Coupling with the fact that price is trying to break a tough rsistance area, have to keep a slightly bearish outlook for the day.

Divergence on 4 Hour

Categories
Forecasts GBP/USD Trading

GBP/USD outlook and forecast

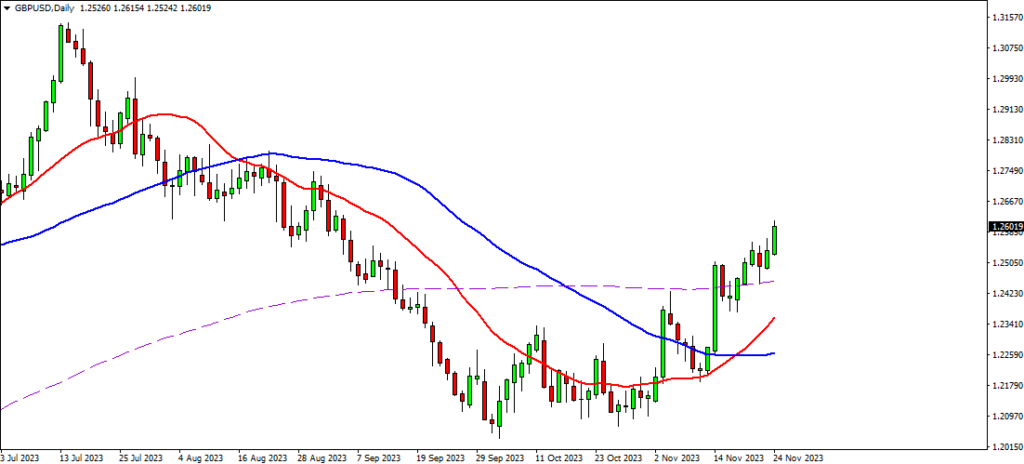
Based on price action only, on the daily, the momentum definitely switching to the buying side. After a month of siddeways price action price is taking off. Next strong resistance is around 1.28240. We might see some sort of correction from that level before it breaks.

When you apply RSI to 4 hour chart, it touched the 70 mark, the overbought area. On the chart the nearest resistancce is at 1.26425. If that breaks next one is at 1.27042. Expecting the price to drop from oine of these levels. On the daily 1.26687 can also be alevel on interest.

Bouncing nicely from 200 on daily

Also on the 4hours the price bouncing nicely from 200 ma. On daily it just bounced. So expecting the price to bounce nicely from here. Any dip from resistance might just be a pull back. So buying in the dip is also valid.

Approaching resistance on daily

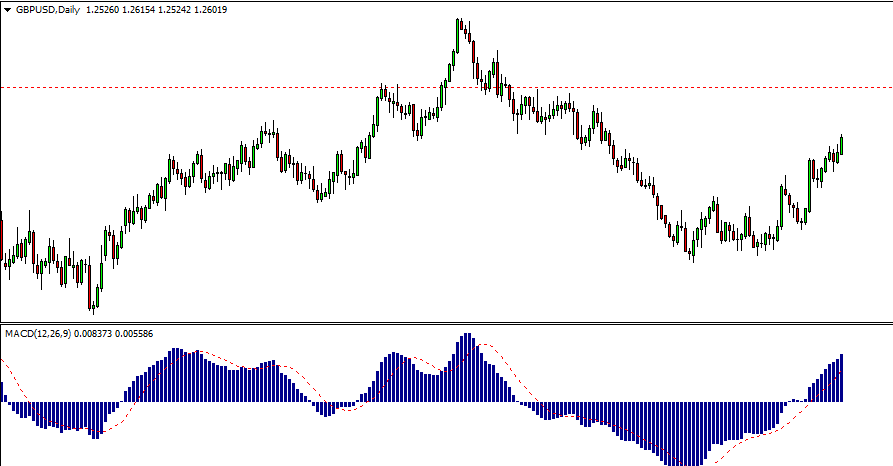
The MACD is backing up, showing strong bullish momentum.

Categories
Uncategorized

A generic way to detect support and resistance with Python

Detecting support and resistance levels in financial data involves analyzing historical price movements to identify levels at which the price has historically had difficulty moving below (support) or above (resistance). Here’s a basic example of how you can use Python and a popular library like pandas to detect support and resistance levels:

import pandas as pd
import matplotlib.pyplot as plt
import numpy as np
from scipy.signal import argrelextrema

# Load historical price data (you can get this data from a financial API or a CSV file)
# For the sake of example, let's create a simple price dataset
data = {
    'Date': pd.date_range(start='2023-01-01', end='2023-12-31'),
    'Close': [100, 110, 95, 120, 90, 115, 105, 125, 85, 130, 110, 140]
}

df = pd.DataFrame(data)
df.set_index('Date', inplace=True)

# Smooth the data using a moving average to identify significant peaks and troughs
window_size = 3
df['SMA'] = df['Close'].rolling(window=window_size).mean()

# Identify local minima (support levels) and maxima (resistance levels)
minima_idx = argrelextrema(df['SMA'].values, np.less, order=window_size)[0]
maxima_idx = argrelextrema(df['SMA'].values, np.greater, order=window_size)[0]

support_levels = df.iloc[minima_idx]['Close']
resistance_levels = df.iloc[maxima_idx]['Close']

# Plotting
plt.figure(figsize=(10, 6))
plt.plot(df.index, df['Close'], label='Close Price')
plt.plot(df.index, df['SMA'], label=f'SMA ({window_size} periods)')
plt.scatter(support_levels.index, support_levels.values, color='green', label='Support Levels', marker='^')
plt.scatter(resistance_levels.index, resistance_levels.values, color='red', label='Resistance Levels', marker='v')
plt.title('Support and Resistance Levels Detection')
plt.xlabel('Date')
plt.ylabel('Price')
plt.legend()
plt.show()

In this example:

  • We use a simple moving average (SMA) to smooth the price data.
  • We identify local minima and maxima in the smoothed data using argrelextrema from scipy.signal.
  • The identified minima correspond to potential support levels, and the identified maxima correspond to potential resistance levels.
  • We plot the original closing prices along with the smoothed curve and mark the detected support and resistance levels.

This is a basic example, and in a real-world scenario, you might want to use more sophisticated techniques and additional indicators to improve the accuracy of support and resistance level detection. Additionally, you could explore libraries like ta-lib for technical analysis or machine learning models for more advanced pattern recognition.
Categories
Money and Sports

How Formula One (F1) Tems Make Money

Formula 1 (F1) teams generate revenue through a combination of various income streams. The financial structure of F1 teams can be complex, and it involves income from several sources. Here are some of the key ways in which Formula 1 teams make money:

  1. Prize Money:
    • Teams earn prize money based on their performance in races and their position in the Constructors’ Championship. The higher a team finishes in the championship standings, the more prize money it receives. This encourages competitiveness and success.
  2. Championship Bonus:
    • Teams that have a historical significance or have been successful in the past may negotiate additional bonuses with Formula 1 management. This can be based on factors such as the number of championships won or the team’s historical contribution to the sport.
  3. Commercial Sponsorship:
    • Sponsorship is a significant source of revenue for F1 teams. They secure commercial partnerships with companies that want to promote their brands through the global exposure that F1 provides. Sponsors’ logos are prominently displayed on the cars, driver suits, helmets, and team merchandise.
  4. Team Partnerships:
    • In addition to primary sponsors, teams often have partnerships with other companies that provide various services or products. These partnerships can include technology sponsors, logistics partners, and more.
  5. Driver Sponsorship:
    • Drivers themselves often bring sponsorship deals to the team. In some cases, a driver’s personal sponsors may also become team sponsors. The marketability and popularity of a driver can impact the team’s ability to attract sponsors.
  6. Merchandising and Licensing:
    • Teams sell branded merchandise, including team apparel, model cars, and other items, to fans. Licensing deals for the use of team logos and trademarks also contribute to revenue.
  7. Hospitality and VIP Experiences:
    • F1 teams offer hospitality packages and VIP experiences to sponsors, partners, and high-profile guests during race weekends. This can include exclusive access, meet-and-greet opportunities with drivers, and premium seating.
  8. Engine and Technical Partnerships:
    • Teams often enter into partnerships with engine suppliers and technical partners. These agreements can involve financial contributions, technology transfers, or other forms of collaboration.
  9. Broadcasting Revenue:
    • While the bulk of the Formula 1 broadcasting revenue goes to the F1 organization, some agreements may involve revenue-sharing with teams. Teams also benefit from exposure through TV broadcasts, which can attract sponsors.
  10. Performance Bonuses and Incentives:
    • Some contracts between teams and drivers include performance bonuses. These bonuses may be triggered by achievements such as race wins, podium finishes, or specific championship standings.

It’s important to note that the financial landscape of Formula 1 is subject to negotiation, and the details of revenue distribution and team agreements can vary. Teams operate in a competitive environment, and financial success often depends on their on-track performance, marketing strategies, and business negotiations.